
I’ll be honest – Google Analytics can be tough.
But wait… don’t leave yet! If you do, your time here will report as a bounce, which means a visitor left the page without any additional interaction. Now that you’re here, we at Ampersand can use Google Analytics and all of its awesomeness to track link clicks, other pages viewed, and when you exit the site altogether. We are not able to track it to you specifically, but we can see that someone on this day clicked this blog and then immediately clicked the back button. Or better yet, maybe we’ll see that someone clicked on this link to the marketing page on our website to read more on our approach to analytics and tracking because they are already interested!
In either case, the point is that having audience data is invaluable for making business decisions. Having Google Analytics data will:
- Inform web design: Knowing what information is being viewed most allows you can prioritize that content to ensure optimal user experience, and a quicker path to purchase.
- Reveal best practices for social media: What type of content is driving the most traffic to your website? Use this information to create your social media strategy and continue creating relevant posts for your audience.
- Help determine which email marketing campaigns will be most successful.
- And everything in between!
So yes, it can be tough, but it would be a shame to have that decision making power at your finger tips and not be able to access it! I’m going to keep it simple and give you a few tips to get started with Google Analytics.
Define goals.
Just like any other aspect of business, it’s important to set goals. Google Analytics goals allow you to easily see how often website visitors are engaging the way you think they will. If those interactions are not happening as intended, that is an indication that you need to review your goals and strategy to ensure potential and repeat customers are getting the information they need.
There are four types of goals in Google Analytics:
-
Destination – Get people to reach a specific URL. For example, when a customer buys something and is directed to a “Thank you for purchasing” page after the transaction is complete. Once that specific destination goal is set up, you can measure the percentage of sessions on your website that resulted in a transaction.
- Duration – Get people to spend more than X minutes per session on your website. This goal type works well with websites full of informational blog posts and photo galleries. If you know it takes approximately 3 minutes for someone to fully read your blog posts or click through photo galleries, you can set up this goal to measure how many people are spending at least 3 minutes per session on your website. This tells you how many sessions have people engaging with your content in the way you want them to.
- Pages Per Session – Get people to click on more than X pages per session. Again, if you have a website full of informational blog posts that link to other pages on your website, it might be important for you to track how many people are clicking on 4 or more pages to give you an idea of how engaging your content is with the audience visiting your website.
- Event – Get people to complete an action (watch a video, download a PDF, etc.) on your website. This goal type is by far the most robust, accurate, and best way to track visitor interactions. The purpose of websites for most small businesses is to generate leads and build brand awareness – both of which require actions on the website like contact forms and downloading PDFs. Because of the complexity, there are extra steps in the setup for this goal which can require an Analytics professional. If you feel that your goal needs fall in this bucket, contact us and we would love to get you started!
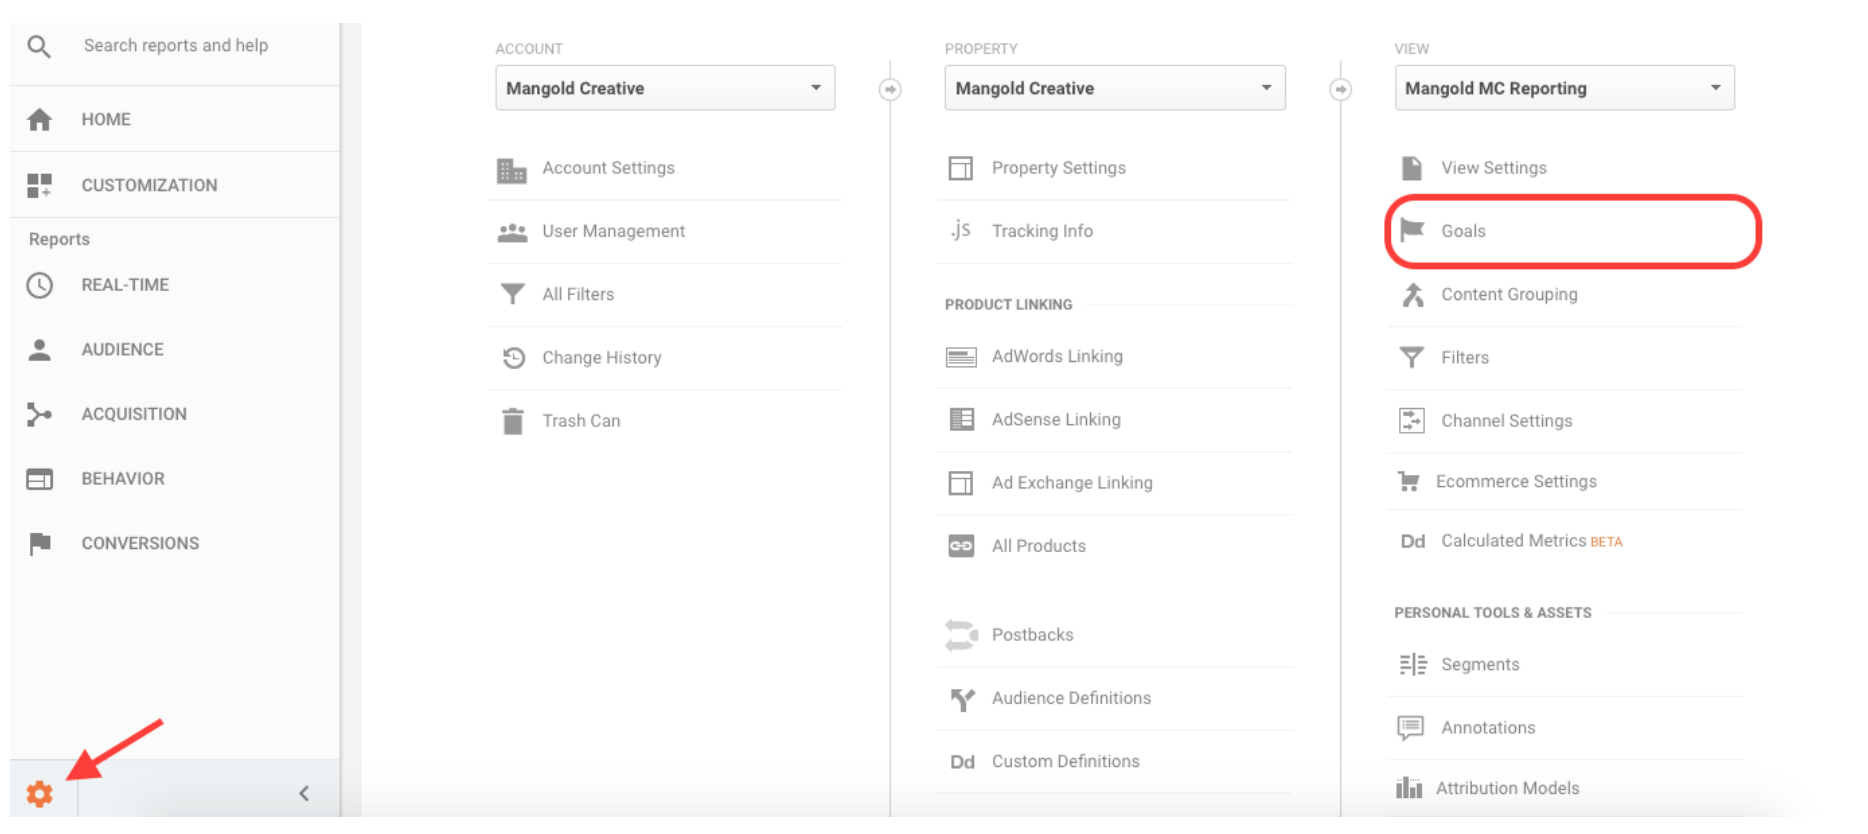
In order to set the goal up, click the “Admin” (gear icon) on the bottom left of your screen and click “Goals.” Then click the red “New Goal” button, give the goal a name, select the goal type, and follow the instructions on the page!
Ultimately, the best use for goals in Google Analytics is to track the metrics that are crucial for generating revenue for your company. Some examples of great things to track are: contact forms, newsletter sign ups, downloads of your content, and anything else that you can click on or do that generates revenue or gets you information on your customers!
Answer the right questions.
You could spend your entire 40 hour work week in Google Analytics and still not have enough time to explore everything, so it’s important that you enter Analytics with relevant questions in mind.
Below are some general questions and the locations where you can find some answers in your reporting.
In the last month/quarter/year:
- How many times was my website visited? (Audience > Overview: Sessions)
- How many people visited my website? (Audience > Overview: Users)
- What is the total number of pages that were viewed? (Audience > Overview: Pageviews)
- On average, how many pages do people view in one session? (Audience > Overview: Pages per session)
- On average, how long do people spend on my website? (Audience > Overview: Average session duration)
- How many people are first-time visitors on my website compared to people returning? Bonus! You can see your goal completions here if you have your goals set up. (Audience > Behavior > New vs. Returning)
- How many people are completing my goal(s)? (Conversions > Goals > Overview)
- How are people finding my website? (Acquisition > All Traffic > Channels)
By no means is this list all-inclusive, but if you can answer these, you’re off to a great start in your Google Analytics adventure!
Compare your findings.
Once you’ve collected data, compare that month to the same month the previous few years. Plot your data monthly to visualize what a full year looks like. Nobody wants to read a table full of numbers, so make graphs. View charts. Give numbers meaning.
Do you notice some patterns? Unexpected seasonality? Months that performed significantly better or worse than the same month last year? Take some time to brainstorm what could be causing those patterns, peaks, or troughs. Did you ramp up your Facebook advertising that month? Run a promotion? Skip a sale?
Making predictions is an important part of website analysis because you want to find actions that are repeatable (or avoidable) over the coming years. The better you can determine what is causing more time on site, for example, the more you can execute that tactic.
Tell somebody.
All this hard work you’ve put in is great; however, if you don’t share the information you’ve found with others on your team, you’ve wasted your time! Looking at data is meant to help make business decisions backed by trends seen in the past. By sharing this information with your coworkers, the decision-makers will get insights into who the customers are and how they interact with your website. The overall goal is to take some of the guess-work out of decisions your company makes on a regular basis!
So, if you are the one who is responsible for reporting analytics, but read this and realized there are a lot of things you can do to improve… or if you are new to Google Analytics (I applaud you for sticking with me) and would like some help taking the first steps, reach out. We would love to get you on the right path!
